Explain Results
The following sections describe how to use the GenChange app to explain
electricity market results.
To understand the model that produces these results, see the Simplex Nodal
tutorial:
www.simplexnodal.com
Information presentation
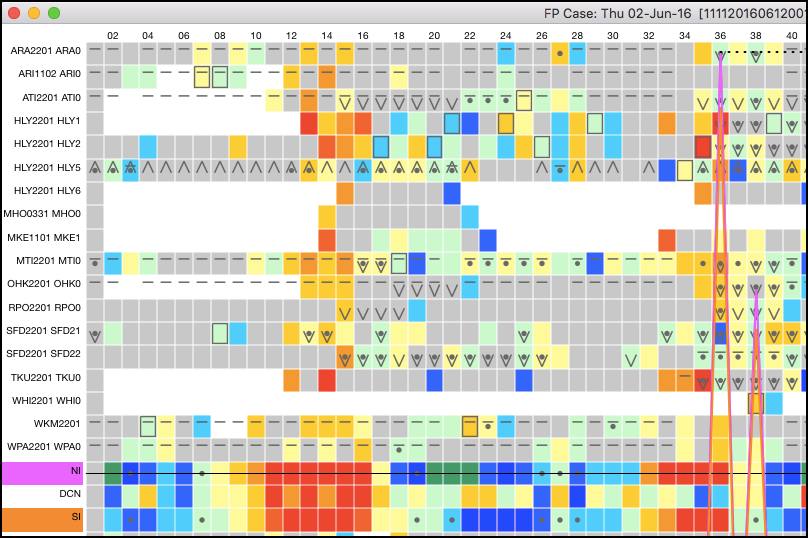
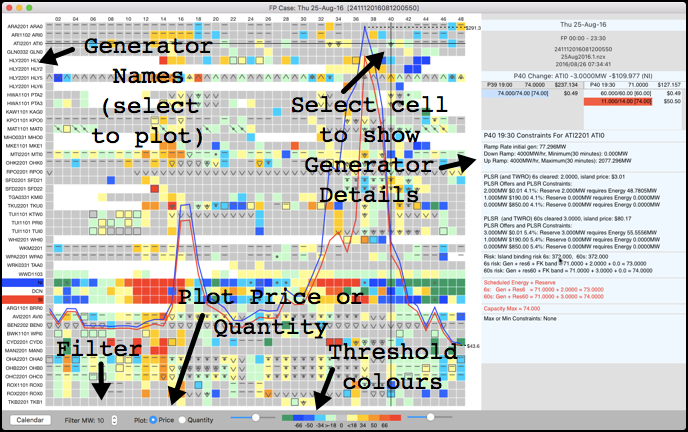
The display presents the results for all generators and all trading periods
in a single view by utilizing:
- Price plots
- Colours to represent direction and magnitude of change
- Status indicators on the change cells:

Odd prices
For a generator the odd prices indicator is displayed when the cleared
offers do not line up with the marginal price at the generator's location.
For an island (NI or SI) the odd prices indicator is displayed when the
island reference price does not follow the island load.
The odd prices can be explained by looking at the Generator Details.
Generator Details: Offers
Click on a change cell to see the generator's offers and constraint details
in the RHS panel.
The first set of details shows the generator's offer tranches:
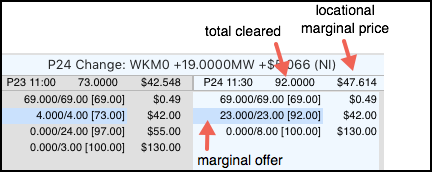
The offer tranches are displayed as:
clearedQuantity/offeredQuantity [offerQuantity running total] $offerPrice
The locational marginal price represents the per MW benefit of generation at
the generator's location.
The offer prices represent the per MW cost of generation cleared from that
offer.
A generation offer will usually clear if the benefit of generation at the
location outweighs the cost of the offer (this is explained in detail by the
the Simplex Nodal tutorial:
www.simplexnodal.com)
An odd price is flagged if generation clears that has a price higher than
the marginal price.
An odd price is flagged if generation has a price lower than the marginal
price and does not clear.
Marginal plant
The marginal plant is the generator that will provide the next MW of energy
and is therefore setting the cost of the next MW of energy... usually this
means that cost of the marginal offer is equal to the locational marginal
price... when this is detected by the app the generator is indicated as the
marginal plant and the prices that were used to detect this are highlighted
green:

Generator Details: Constraints
The remaining Generator Details consist of the constraints that the
generator is subject to. These constraints can be used to explain odd
prices. Binding constraints have red text. The constraint are as follows.
Binding PLSR%
The PLSR% constraint caps a generator's cleared PLSR (partly loaded spinning
reserve) at a % of its generation (reserve is cleared to cover the largest
risk, see the binding risk section below). If the PLSR% constraint binds
then in order to allow PLSR to clear, generation offers may clear even
though their price is above the locational marginal price.
In the following example the locational marginal price is $44.873.
Despite this an energy offer with a cost of $45.10 has cleared.
This is because the generation will allow PLSR to clear and the benefit of
this PLSR (i.e., the benefit of the risk covered by the PLSR) discounts the
cost of the generation offer, to the extent that it is less than or equal to
the locational marginal price (in this case the fact that the offer tranche
has partially cleared indicates that its cost, after subtracting the benefit
of the reserve, is equal to the locational marginal price).
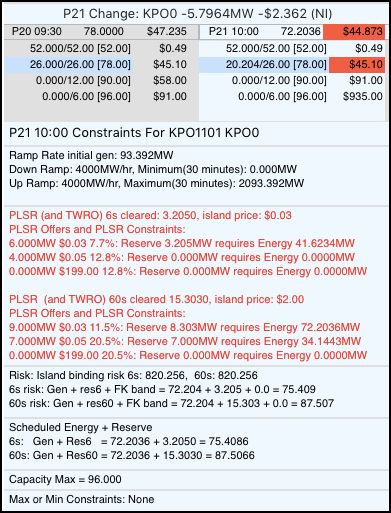
The PLSR text is red because the generation required by the PLSR% constraint
matches the 72.2036MW of cleared generation. Note that for the purposes of
this highlighting a "match" occurs if the quantities are within 0.05MW. It
is necessary to have this threshold because the generation and reserve
results are provided to 4 and 3 decimal places respectively, whereas the
solver is working to a much higher precision.
Binding capacity
The capacity constraint caps the sum of the generator's cleared energy and
reserve at the capacity of the generator. A binding capacity
constraint will prevent generation from clearing if cleared reserve has a
greater benefit, i.e., if reserve is a more beneficial use of the capacity.
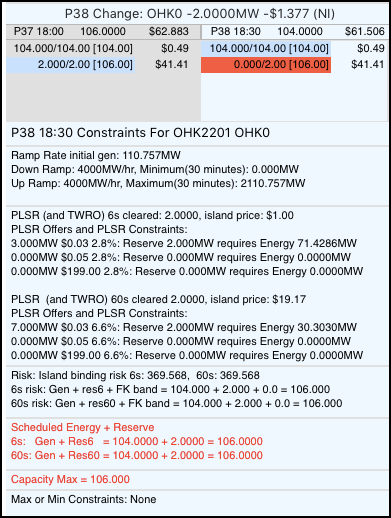
In the example below the marginal price is $61.506. Despite this, an energy
offer with a cost of $41.41 was not cleared. This is because the capacity
constraint is binding and clearing reserve provides more benefit. The energy
+ reserve result is red because the total is equal to the RHS of the
capacity constraint.
The per MW benefit of $61.506 - $41.41 that would be obtained by clearing
the energy offer is outweighed by the per MW benefit due to providing 6s and
60s reserve ($1.00 - $0.03) + ($19.17 - $0.03). [The island reserve prices
are obtained from the PLSR section]
Binding ramp rate
The ramp rate constraint models the rate at which a generator can increase
or decrease its generation.
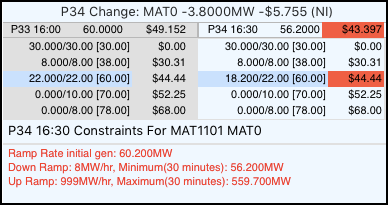
In the example below, the initial generation at the start of the trading
period was 60.20MW. Given its ramp rate, the minimum that the generator
could ramp down to was 56.20MW. Meeting this level of generation required
the clearing of an offer that was priced higher than the locational marginal
price.
Risk setter
The electricity market model ensures that there is spare capacity available
to replace the largest quantity of at-risk generation. This spare capacity
is referred to as reserve (partly loaded spinning reserve (PLSR) is an
example of reserve). If the reserve to cover the at-risk generation costs
more than the benefit provided by that generation then the generation will
not fully clear.
The following example is from a generator that is indicated as being a risk
setter with an odd price. The generation of 338.7903MW matches the island
reserve requirement for fast (6s) reserve and slow (60s) reserve, indicating
that this is the risk that the reserve is covering. Hence, the cost of both
of these classes of reserve contribute to the total cost of the generation.
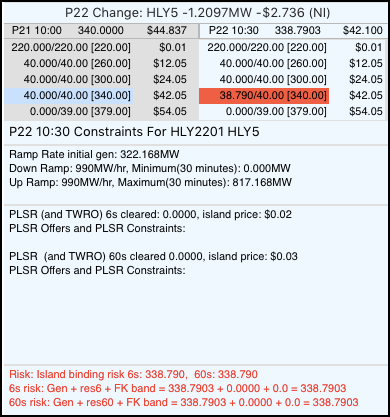
The highlighting indicates that the $42.05 offer would normally have fully
cleared, because it is priced lower than the $42.10 marginal price. However,
the cost of this generation must include the cost of the reserve that covers
it, hence the total cost of the generation is:
offer price + reserve to cover risk
= $42.05 + $0.02 (6s reserve cover) + $0.03 (60s reserve cover) = $42.10
Note that this cost matches the locational marginal price, indicating that
this generator is the marginal plant, which is also indicated by the fact
that its final offer tranche is partially cleared. It is not indicated
as the marginal plant because currently the checking only compares the
marginal offer price and the locational marginal price.
Market node constraints
A generator that is cleared to provide frequency keeping (FK) must be able
to vary its generation by the amount of the cleared FK Band... this
capability is enforced by a set of market node constraints. These FK
constraints ensure that the cleared generation is above the FK Min by the
amount of the FK Band, and below the FK Max by the amount of the FK Band.
The FK Min and Max are the minimum and maximum levels of generation at which
the generator can provide FK.
Often it is a block of generators that is cleared to provide the FK Band. In
this case the constraints apply to the sum of the generators in the block.
When the FK constraints bind, the generator (or a generator in the block)
may be cleared higher or lower than its marginal price would indicate.
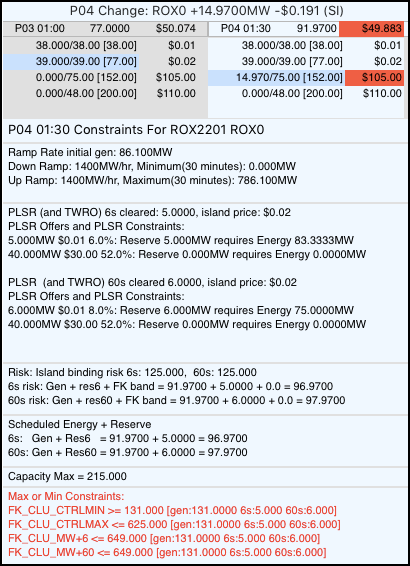
In the example below the highlighting indicates that the price of the
cleared generation ($105.00) is higher than its marginal price ($49.883).
The FK constraints are highlighted. There are a number of FK constraints,
with a minimum constraint that applies only to energy and maximum
constraints that apply to a combination of energy and reserve. The app
highlights them all, even though it may be only one of them that is binding.
Comparing the RHS of the constraints to the generation and reserve totals
shows that in this case it is the FK Min constraint that is binding, at
131MW.
For this case the main display shows that the FK Band is provided by a block
of generators, as indicated by the SI generators that display the "--"
symbol in the screenshot below. It is the sum of these generators that must
meet the requirements of the constraint... the 220 ROX0 generation does not
match the constraint RHS, rather it is the sum of CYD0, 110 ROX0 and 220
ROX0 that meet the requirement, but the constraint only binds on the 220
ROX0 generation.
Note that in order to display 110 ROX0, the max change filter needed to be
lowered to 1 because 110 ROX0 does not change by more than 1MW during the
day.
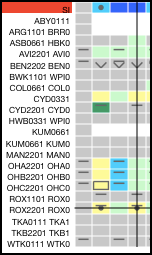
The other generators in the FK block are shown below. The total of all is
131MW. The other generators do not have odd prices:


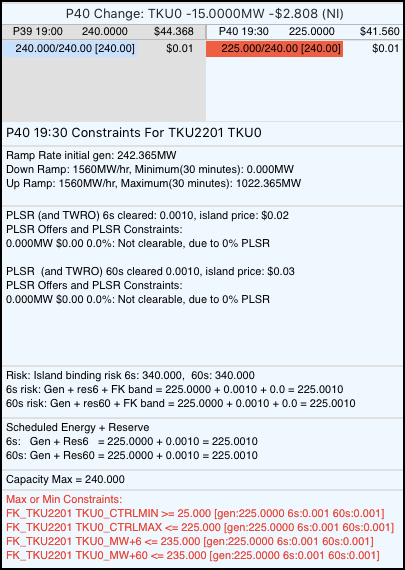
The following is an example of an FK provider that is a single generator. In
this case the generator is constrained by the Max constraint, causing the
highlighted offer to not fully clear even though it is priced lower than the
marginal price:
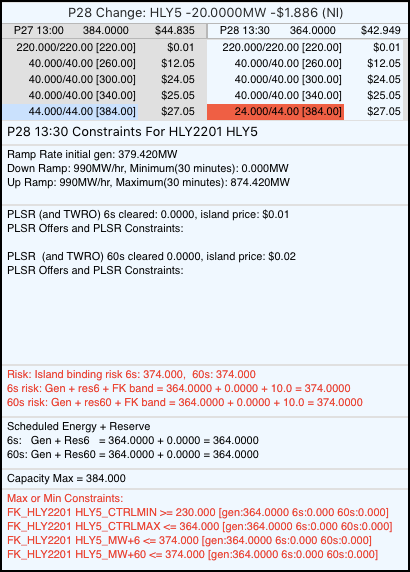
The following example shows a generator that is binding on its FK Max
constraint of 364MW for generation, and is also setting the island risk of
374MW, which is the 364MW of generation plus the 10MW of cleared FK Band.
The market node constraint is mostly used to ensure the availability of the
frequency keeping band, however it can also be used to constrain a generator
for other reasons:
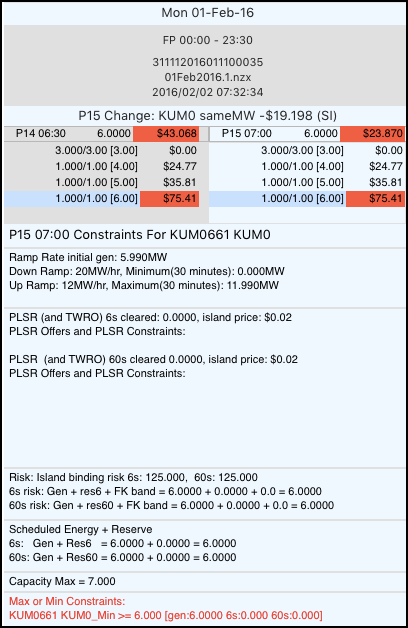
Although it is not always obvious what these reasons are, in this case a
quick Google search suggests that the reason is to provide system security:
https://www.systemoperator.co.nz/sites/default/files/bulk-upload/documents/Part%20D%20GZ12.pdf

Odd island price
For example, an NI & SI odd price:
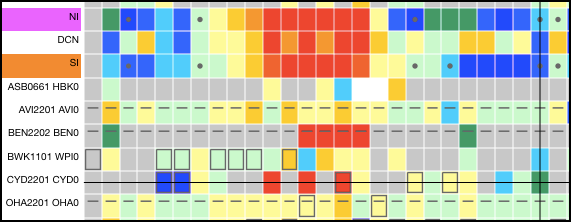
The colours indicate that the CYD change exceeded the island change.
Clicking the CYD change cell presents the following Generator Details:

CYD decreased by 64MW because a total of 400MW costing $20 in P25 was
replaced by 336MW costing $40 in P26. This 64MW decrease exceeded the island
decrease, contributing to the island price increasing even though the island
total requirement decreased.
Price spikes
The interesting things to view regarding price spikes are:
- The generators that were capacity constrained
- The expensive offers that caused the high prices
